Warehouse Insights

Actively prevent problems, continuously optimize operations, know what exactly is happening on the warehouse floor with real-time analytics and actionable intelligence. Introducing AgiSight’s Warehouse Insights, a modern, scalable, and powerful warehouse operations analytics solution powered by Unified Warehouse Data.

"AgiSight has helped us improve our order fulfillment percentage by tacking the challenge of picking exceptions including employee skips, alternates and shorts head-on. With detailed insights into employee activity and performance, we've been able to identify areas for improvement, implement targeted training programs, and boost picking accuracy."

-Fortune 50 Retailer

KPIs of Focus

Warehouse Insights KPIs & Metrics

Dock to Stock Time
Order Cycle Time
Warehouse Capacity
Perfect Order %
3 boxes stacked to show inventory
Inventory Accuracy
Cost Per Unit

Sample Key Metrics

On-Time Delivery
Shipped Complete
Cycle Count %
Damage Free
icon showing inventory being replenished
Inventory Turns
Mispick Percentage

Top to Bottom
Warehouse Visibility

Hierarchy

Network
Warehouse
Shift
Work Center
Supervisor
Employee

Data Collected

Receipts
Putaways
icon showing cartons shipped
Cartons Picked
icon showing inventory being replenished
Replens
shipping truck with check mark
Cartons Shipped
icon showing working conducting a cycle count
Cycle Counts
3 boxes stacked to show inventory
Inventory

Time Collected

Hourly
Daily
Weekly
Monthly
Quarterly
Yearly

Drive Enterprise-Wide
Efficiency and Savings

Better, Faster, and Smarter Warehouse Operations.

AgiSight’s Warehouse Insights provide all the benefits of a world class data science team at your fingertips.

  • Real-time supply chain analytics: Unlock unparalleled levels of supply chain visibility into every action being taken on the warehouse floor, access these insights from any device, anywhere in the world.
  • Transition from reaction to proactive prevention: Unified data model powered analytics include proactive problem identification and prescriptive insights to remedy the identified issue.
  • Same Systems, Better Outcomes: Combine all of the data you are already collecting into AgiSight’s proprietary unified data model, break down data silos and embrace a single source of truth for your operations.
  • Rapid Time to Value: As a turnkey supply chain analytics solution complete with an easy implementation and intuitive design- reaping benefits from the platform starts on day 1 and ROI is secured in 90 days or less.

Better Analytics, Better Data, and Better Operations

Deploy unified data model powered analytics at your fingertips without the risk, cost, and time required to build them in-house.
  • Improved inventory accuracy: Know exactly what you have on your shelves at any given moment.

  • Optimize capacity across your network: Get the insights that allow you to better allocate resources to maximize operational performance.

  • Ensure every order is a perfect order: Keep your customers happy and coming back for more by removing the headaches and costs associated with botched orders. 

  • Cut costs: prescriptive analytics helps our customers reduce their cost per unit by an average of 5% across their entire supply chain network.
  • Designed for you: Our platform is fully customizable and configurable to ensure complete and total alignment with your organization and your needs.

Warehouse Insights Fundamentals

Dock Door Command Center: Gain real-time visibility into trailers, ASNs, and the flow of work coming in and out of your dock doors. This includes tracking remaining on unfinished tasks, monitoring productivity levels, and accessing other essential metrics required for optimizing load and unload processes.

Receiving Command Center: Analyze real-time data to gain visibility into the receiving process of trailers at your warehouse. Metrics include: time remaining, specific requirements for individual ASNs, and other dock door level insights for incoming resources.

Lost Inventory: Gain the ability to analyze and research inventory losses within a specific time period, including tracking last known location. Utilize the available data to equip yourself with the necessary tools for locating lost inventory.

Wave Command Center: Access a comprehensive overview of all ongoing tasks within the outbound process. Metrics provided encompass status updates, remaining tasks, total task count, and visibility into the unwaved order pool, categorized by various metrics to enhance work planning efficiency. Dive into each wave to balance outstanding tasks across individuals and teams, review SKUs allocated to each wave and explore additional details.

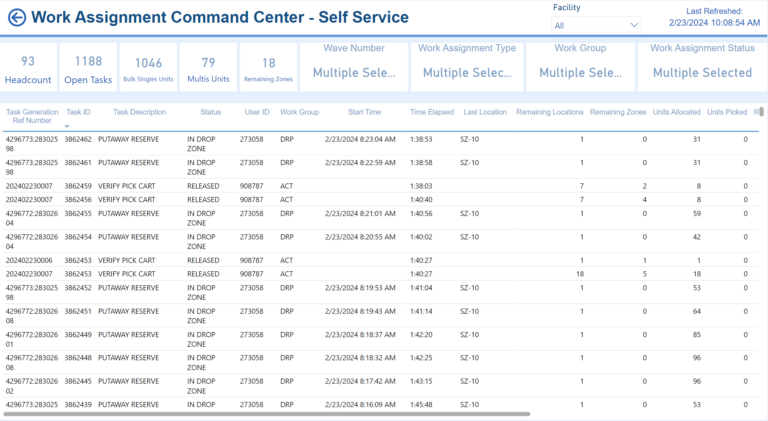
Work Assignment Command Center: Gain a comprehensive view of all your labor tasks with the warehouse. This unified visualization categorizes tasks by type and work center, providing detailed insights into the individual assignments, through this you can easily track the status of all outstanding tasks.

Putaway Command Center: Achieve complete visibility into your Putaway operations to ensure seamless task execution, better labor allocation, and improved productivity. Metrics include: LPNs on the dock, units on the dock, completed LPNs and cases, open tasks, and more

Replenishment Command Center: Gain a comprehensive view of your replenishment operations to ensure seamless task execution, optimal productivity, and better labor allocation. Metrics include: LPNs on the dock, units on the dock, completed LPNs and cases, open tasks, and more

Picking Command Center: Gain complete control over your picking operations with insights that notify you when labor allocation optimization is needed and provide comprehensive visibility. Key metrics include: wave number, pick rate, allocated picks, pick type, open picks, time remaining, and more.

Shipping Command Center: Gain the real-time visibility and analyze insights need to fully optimize your shipping process. Key metrics include: Open shipments, Shipments in the last 24 hours, Orders shipped in the last 24 hours, Units shipped in the last 24 hours, split shipments, split orders, late shipments, total variance, and more.
Cycle Count Command Center: Analyze real-time data to achieve comprehensive visibility into the cycle count process. Metrics include: Cycle counts by user, Completed counts, open counts, count variance, net dollar variance, cycle count time, and more.

Location Utilization: Gain the real-time visibility into how much your teams are using the platform. Like most tool, AgiSight works best when everyone is working together to leverage the system, with this tool you can see how much each individual location and team is working with the system.

Self Service Reporting

Streamline Your Supply Chain Operations with Self Service Advanced Analytical Insights and Enhanced Task Management.
The work assignment command center offers unique details regarding individual tasks that are not available elsewhere in AgiSight. It provides information on task locations, required actions, assigned personnel, and more.
receipts self service reporting
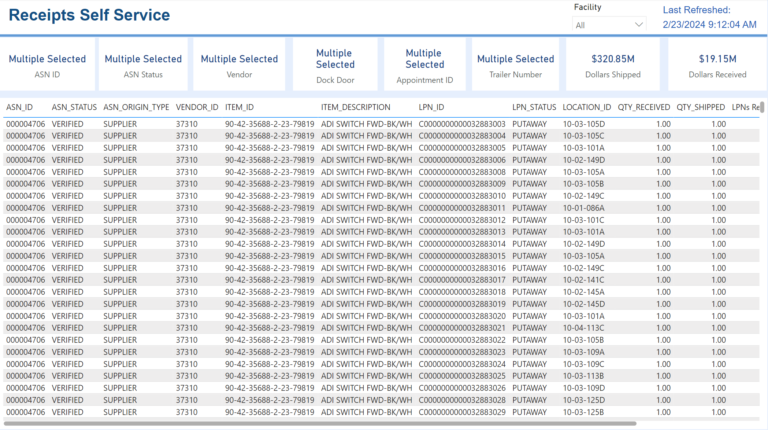
The receipt self-service feature offers a detailed examination at the LPN level of received shipments. It displays values such as the dollar amount received, units received, shortages, surpluses, etc., and facilitates the analysis of historical data.
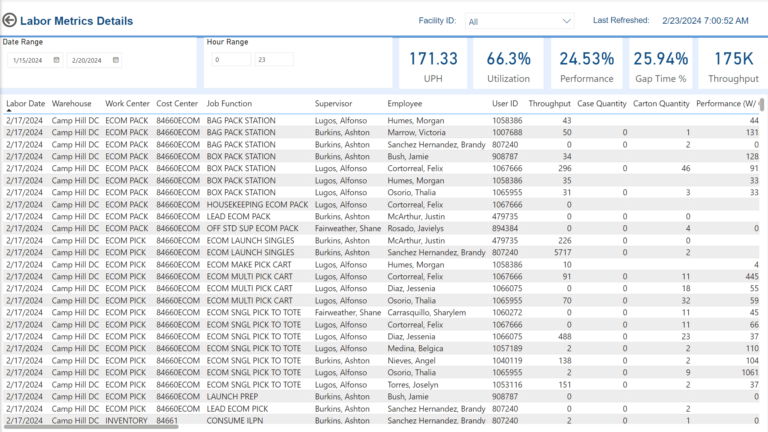
The labor metrics detail allows users to view metrics such as performance, total time, utilization, and actual hours at a transactional level. This enables the identification of strengths and weaknesses for both groups and individual employees.
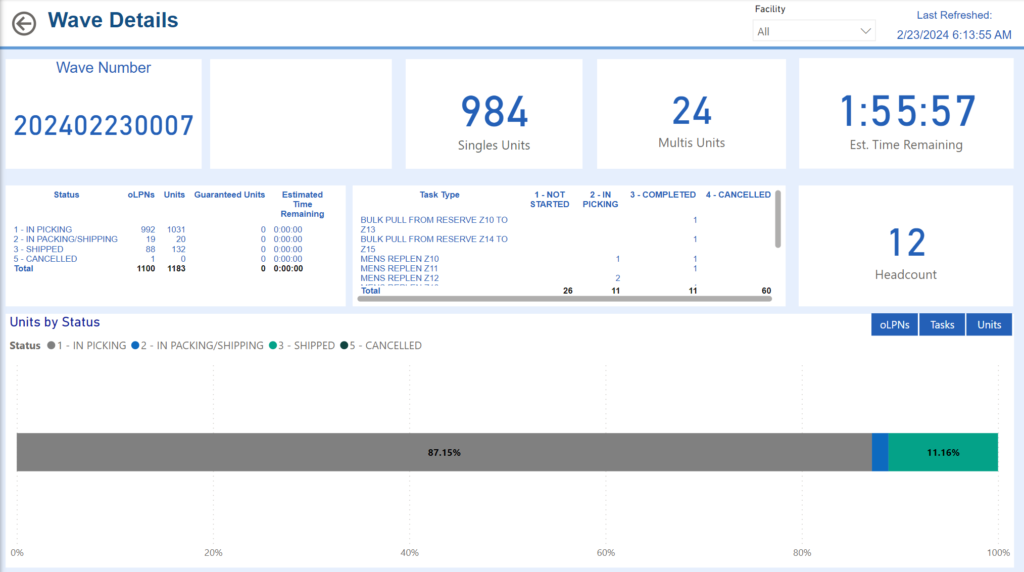
The wave details aim to provide a comprehensive view of the remaining work within a wave (a group of tasks required to complete orders). It offers valuable insights by presenting estimated time remaining and headcount.

Demo Video

The waving visibility provided by AgiSight has revolutionized our order fulfillment process. We now have a clear view of wave progress, allowing us to prioritize tasks, move associates and meet customer demands and shipping schedules more effectively.

-Fortune 500 CPG Retailer

Additional Content

Why the Silos? 

Why the Silos?  by Daniel Breiner For years, we have observed how many companies manage their supply chains through a fragmented structure, …

In today's fast-paced and data-driven world, supply chains are becoming increasingly complex. Organizations are constantly seeking ways to streamline their operations, improve collaboration, and enhance visibility across their supply chains. Enter the age of low-code analytics platforms – a paradigm shift in the direction of democratizing access to data and advanced analytics such as predictive or prescriptive insights. As the industry rapidly traverses this path, it begs the question: What are the benefits of deploying these platforms for end-to-end unified supply chain analytics? 

Understanding Cost to Serve with AgiSight by Robert Fulghum Within network optimization, a cost to serve model calculates the comprehensive cost of …

Transforming Your Supply Chain: From Batch Processing to Change Data Capture by Reed Stepleman The Need for Agility in Today’s Supply Chain …

Power BI Dashboard Design for Faster Rendering  by Kaitlyn Joyce In today’s data-driven world, the ability to quickly access and analyze data …

You have successfully subscribed to the newsletter

There was an error while trying to send your request. Please try again.

Agillitics will use the information you provide on this form to be in touch with you and to provide updates and marketing.